Ocean currents are either wind-driven or density-driven. Moving air masses—particularly the major wind belts of the world—set wind-driven currents in motion. Wind-driven currents move water horizontally and occur primarily in the ocean’s surface waters, so these currents are called surface currents.
Density-driven circulation, on the other hand, moves water vertically and accounts for the thorough mixing of the deep masses of ocean water. Some surface waters become high in density—through low temperature and/or high salinity—and sink beneath the surface. This dense water sinks and spreads slowly beneath the surface, so these currents are called deep currents.’
Types of Ocean Currents
- Surface currents
– Wind-driven
– Primarily horizontal motion - Deep currents
– Driven by differences in density caused by
differences in temperature and salinity
– Vertical and horizontal motions
Measuring Surface Currents
- Direct methods
– Floating
device tracked
through time
– Fixed current meter - Indirect methods
– Pressure gradients
– Radar altimeters
– Doppler flow meter
Direct Methods
Two main methods are used to measure surface currents directly. In one method, a floating device is released into the current, and its position is tracked over time. Typically, radio-transmitting float bottles or other devices are used, but sometimes accidentally released items can also serve as drift meters. Another method employs a current-measuring device, such as a propeller flow meter, which is deployed from a fixed position, like a pier or stationary ship. A propeller device can also be towed behind a ship, with the ship’s speed subtracted to determine the current’s true flow rate.

Indirect Methods
Three different methods are used to measure surface currents indirectly. The first method involves pressure gradients, caused by large-scale bulges and depressions in the ocean’s surface. Water flows parallel to a pressure gradient (downhill), and this method determines the internal distribution of density and the corresponding pressure gradient in the ocean. The second method uses radar altimeters, often aboard Earth-observing satellites, to determine the lumps and bulges at the ocean surface, which result from the shape of the underlying seafloor and current flow. These data produce dynamic topography maps that show the speed and direction of surface currents. The third method uses a Doppler flow meter, which transmits low-frequency sound signals through the water. The flow meter remains stationary and measures the shift in frequency between emitted sound waves and those backscattered by particles in the water to determine current movement.
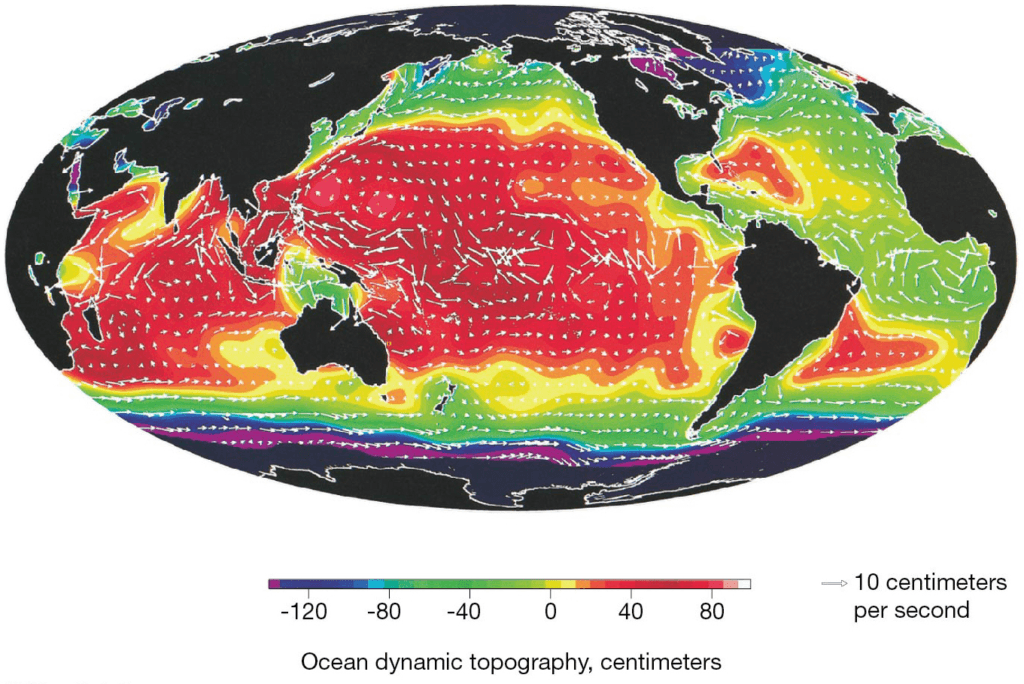
height, in centimeters, from September 1992 to September 1993.
Measuring Deep Currents
- Chemical tracers
– Tritium
– Chlorofluorocarbons - Characteristic temperature and salinity
The great depth at which deep currents exist makes them even more difficult to measure than surface currents. Most often, they are mapped using underwater floats that are carried within deep currents. One such unique oceanographic program that began in 2000, called Argo, is a global array of free-drifting profiling floats that move vertically and measure the temperature, salinity, and other water characteristics of the upper 2000 meters (6600 feet) of the ocean. Once deployed, each float sinks to a particular depth, drifts for up to 10 days collecting data, then resurfaces and transmits data on its location and ocean variables, which are made publically available within hours. Each float then sinks back down to a programmed depth and drifts for up to another 10 days, collecting more data, before resurfacing and repeating the cycle. In 2007, the goal of the program was achieved with the launch of the 3000th Argo float; currently, nearly 4000 floats are operating worldwide. The program will allow oceanographers to develop a forecasting system for the oceans analogous to weather forecasting on land and also track changes in ocean properties as a result of human-caused climate change.
Other techniques used for measuring deep currents include identifying the distinctive temperature and salinity characteristics of a deep-water mass and tracking telltale chemical tracers. Some tracers are naturally absorbed into seawater, while others are intentionally added. Some useful tracers that have inadvertently been added to seawater include tritium (a radioactive isotope of hydrogen produced by nuclear bomb tests in the 1950s and early 1960s) and chlorofluorocarbons (Freon and other gases that deplete Earth’s ozone layer)

data on the ocean properties before resurfacing and transmitting their data.

research or cargo vessels.
Surface Currents
- Occur above pycnocline
– Affect only 10% of ocean water on Earth - Friction between wind and ocean surface
– 2% of wind energy transferred to ocean surface
– Surface currents slower speed than corresponding winds - Generally follow Earth’s wind belt pattern
- Distribution of continents
– Influences flow in each ocean basin - Other current influences
– Gravity
– Friction
– Coriolis effect

Subtropical Gyres
The large, circular-moving loops of water that are driven by the major wind belts of the world are called gyres (gyros = a circle). The world’s five subtropical gyres include:
- The North Pacific Gyre
- The South Pacific Gyre
- The North Atlantic Gyre
- The South Atlantic Gyre
- The Indian Ocean Gyre (which is mostly within the Southern Hemisphere)
They are called subtropical gyres because the center of each gyre coincides with the subtropics at 30 degrees north or south latitude.

major subtropical gyres are 1 the North Pacific Gyre, 2 the South Pacific Gyre, 3 the North Atlantic Gyre, 4 the South Atlantic Gyre, and 5 the Indian Ocean Gyre. Smaller subpolar gyres exist in higher latitudes and rotate in the reverse direction of their adjacent subtropical gyres.
Gyres and Boundary Currents
| subtropical gyres and surface currents | |||||
| North Pacific Gyre | North Atlantic Gyre | Indian Ocean Gyre | |||
| Pacific Ocean | North Pacific Current | Atlantic Ocean | North Atlantic Current | Indian Ocean | South Equatorial Current |
| California Currenta | Canary Currenta | Agulhas Currentb | |||
| North Equatorial Current | North Equatorial Current | West Wind Drift | |||
| Kuroshio (Japan) Currentb | Gulf Streamb | West Australian Currenta | |||
| South Pacific Gyre | South Atlantic Gyre | Other Major Currents | |||
| South Equatorial Current | South Equatorial Current | Equatorial Countercurrent | |||
| East Australian Currentb | Brazil Currentb | North Equatorial Current | |||
| West Wind Drift | West Wind Drift | Leeuwin Current | |||
| Peru (Humboldt) Currenta | Benguela Currenta | Somali Current | |||
| Other Major Currents | Other Major Currents | ||||
| Equatorial Countercurrent | Equatorial Countercurrent | ||||
| Alaskan Current | Florida Current | ||||
| Oyashio Current | East Greenland Current | ||||
| Labrador Current | |||||
| Falkland Current | |||||
| aDenotes an eastern boundary current of a gyre, which is relatively slow, wide, and shallow (and is also a cold-water current). bDenotes a western boundary current of a gyre, which is relatively fast, narrow, and deep (and is also a warm-water current). | |||||
Equatorial Currents
The trade winds, blowing from the southeast in the Southern Hemisphere and from the northeast in the Northern Hemisphere, move the water masses between the tropics. These resulting currents are called equatorial currents, traveling westward along the equator and forming the equatorial boundary currents of subtropical gyres. They are classified as north equatorial currents or south equatorial currents based on their position relative to the equator.
Western Boundary Currents
When equatorial currents reach the western side of an ocean basin, they cannot cross land, so the Coriolis effect deflects them away from the equator, creating western boundary currents. These currents form the western boundaries of subtropical gyres, such as the Gulf Stream and the Brazil Current. Western boundary currents come from warm equatorial regions and transport warm water to higher latitudes.
Northern or Southern Boundary Currents
Between 30 and 60 degrees latitude, the prevailing westerlies direct ocean surface waters eastward across the ocean basin. In the Northern Hemisphere, these are called northern boundary currents, while in the Southern Hemisphere, they are referred to as southern boundary currents. These currents make up the northern and southern parts of subtropical gyres.
Eastern Boundary Currents
As currents flow back across the ocean basin, they are turned toward the equator by the Coriolis effect and continental barriers, forming eastern boundary currents. Examples include the Canary Current and the Benguela Current, which transport cooler water from higher latitudes to lower latitudes.
Equatorial Countercurrents
A large volume of water is driven westward by the equatorial currents, creating a higher sea level on the western side of the ocean basin near the equator. Gravity causes this bulge of water to flow eastward, creating the equatorial countercurrent, which flows in the opposite direction to the adjoining equatorial currents.
Subpolar Gyres
As northern or southern boundary currents flow eastward into subpolar latitudes (around 60 degrees latitude), they are driven by polar easterlies, forming subpolar gyres. These smaller gyres rotate in the opposite direction of subtropical gyres, with examples found in the Atlantic Ocean between Greenland and Europe and the Weddell Sea off Antarctica.
Ekman Spiral and Ekman Transport
- Observation that Arctic Ocean ice moved at a 20- to 40-degree angle to the right of the wind
- Southern Hemisphere movement to the left of the wind
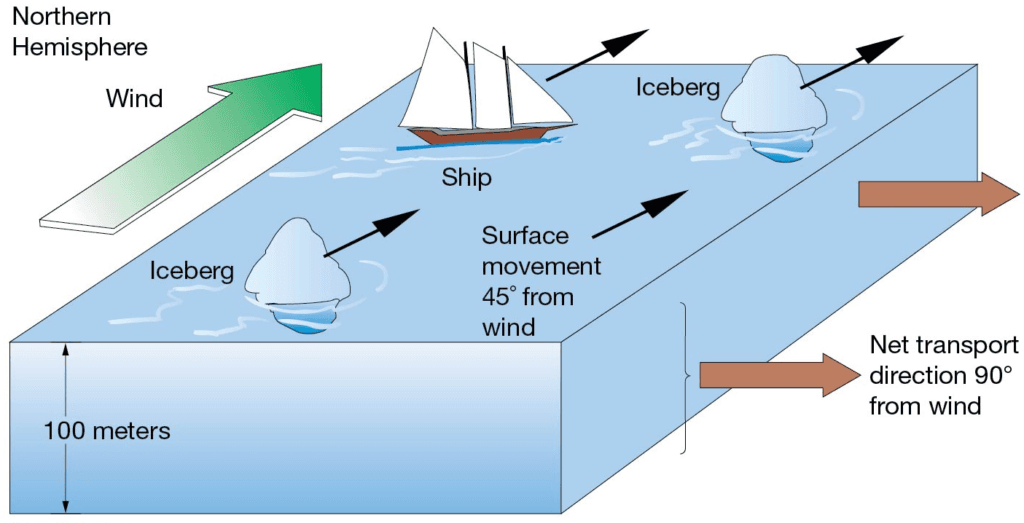
Ekman Spiral
- V. Walfrid Ekman
– Developed circulation model in 1905 - Ekman spiral
– Explains balance between friction and Coriolis effect
– Describes direction and flow of surface waters at different depths

Ekman Transport
- Ekman transport
– Average movement of surface waters
– 90 degrees to right in Northern Hemisphere
– 90 degrees to left in Southern Hemisphere

Geostrophic Currents
- Ekman transport generates rotational flow in ocean basin.
- Subtropical Convergence – piling up of water in middle of gyre
- Surface water flows downhill and is deflected
– Right in Northern Hemisphere
– Left in Southern Hemisphere

high. Ideally, gravity and the Coriolis effect balance each other to create an ideal geostrophic current that ows in equilibrium
around the hill. However, friction makes the current gradually run downslope (path of actual geostrophic flow)
- Geostrophic current
– Balance of Coriolis effect and gravitational forces
– Moves in circular path downhill - Ideal geostrophic flow
- Friction generates actual geostrophic flow.

Western Intensification
- Top of hill of water displaced toward west due to Earth’s rotation.
- Western boundary currents intensified in both hemispheres.
– Faster
– Narrower
– Deeper
– Warmer - Coriolis effect contributes to western intensification.
Eastern Boundary Currents
- Eastern side of ocean basins
- Tend to have the opposite properties of Western Boundary Currents
– Cold
– Slow
– Shallow
– Wide
Eastern and Western Boundary Currents
| characteristics of western and eastern boundary currents of subtropical gyres | ||||||
| Current type | Examples | Width | Depth | Speed | Transport volume (millions of cubic meters per seconda) | Comments |
| Western boundary current | Gulf Stream, Brazil Current, Kuroshio Current | Narrow: usually less than 100 kilometers (60 miles) | Deep: to depths of 2 kilometers (1.2 miles) | Fast: hundreds of kilometers per day | Large: as much as 100 Sva | Waters derived from low latitudes and are warm; little or no upwelling |
| Eastern boundary current | Canary Current, Benguela Current, California Current | Wide: up to 1000 kilometers (600 miles) | Shallow: to depths of 0.5 kilometer (0.3 mile) | Slow: tens of kilometers per day | Small: typically 10 to 15 Sva | Waters derived from middle latitudes and are cool; coastal upwelling common |
| aOne million cubic meters (35.3 million cubic feet) per second is a flow rate equal to one Sverdrup (Sv). | ||||||
Ocean Currents and Climate
- Warm ocean currents warm the air at the coast.
– Warm, humid air
– Humid climate on adjoining landmass - Cool ocean currents cool the air at the coast.
– Cool, dry air
– Dry climate on adjoining landmass
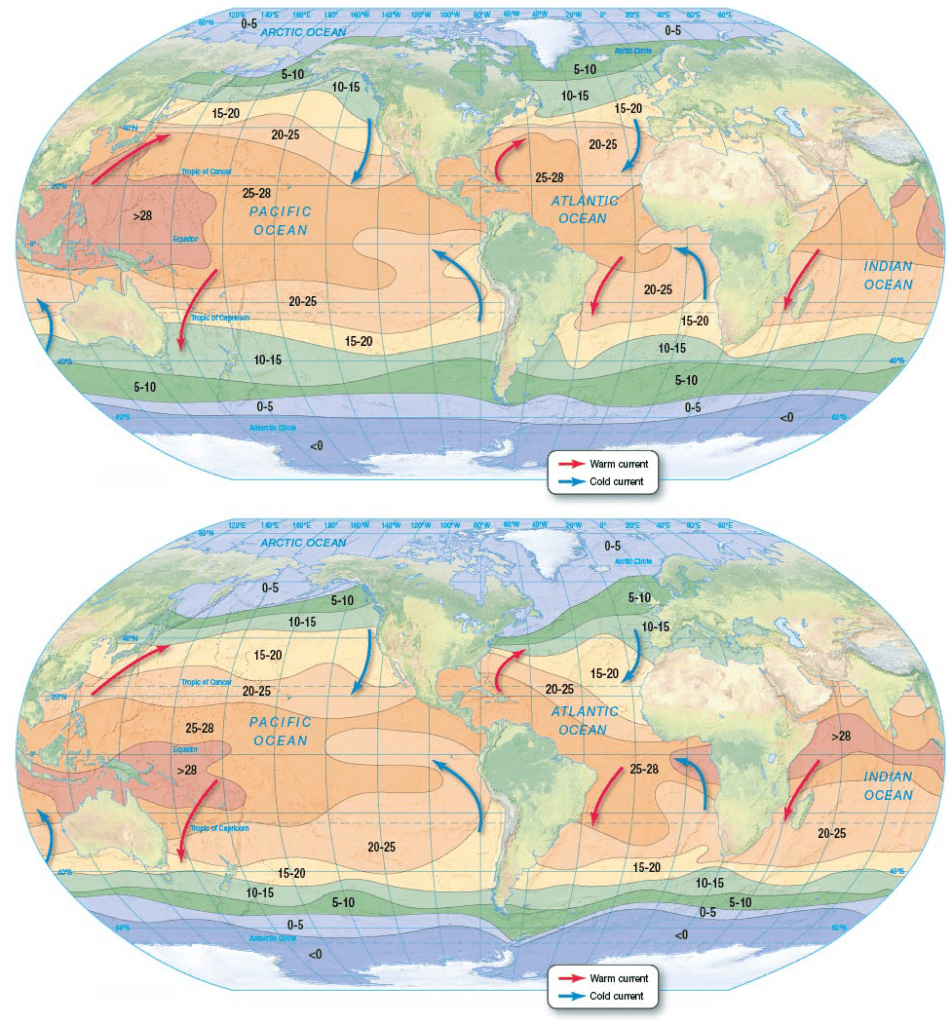
Upwelling and Downwelling
Upwelling is the upward movement of cold, deep, nutrient-rich water to the surface, while downwelling is the downward movement of surface water to deeper parts of the ocean. Upwelling brings cold, nutrient-rich water to the surface, which leads to high productivity, especially for microscopic algae, forming the foundation of the food web that supports large marine life like fish and whales.
Downwelling, in contrast, results in much lower surface productivity but delivers dissolved oxygen to deep-sea organisms. Both upwelling and downwelling play crucial roles in mixing surface and deep waters, driven by various processes in the ocean.
Key Points
- Upwelling – Vertical movement of cold, nutrient-rich water to surface
– High biological productivity – an abundance of algae at the base of the food web - Downwelling – Vertical movement of surface water downward in water column
Diverging Surface Water
Current divergence occurs when surface waters move away from an area on the ocean’s surface, such as along the equator. The South Equatorial Current is positioned along the geographical equator, notably in the Pacific Ocean, while the meteorological equator (where the doldrums are found) is typically a few degrees north.
As the southeast trade winds blow across this region, Ekman transport causes surface water north of the equator to veer to the right (northward) and water south of the equator to veer to the left (southward). This results in a divergence of surface currents along the geographical equator, leading to upwelling of cold, nutrient-rich water. This phenomenon, known as equatorial upwelling, is especially common in the Pacific Ocean and creates highly productive areas, which are among the most abundant fishing grounds in the world.

key Points
- Surface waters move away from area.
- Equatorial upwelling
– Divergence of currents at equator generates upwelling and high productivity.
Converging Surface Water
Current convergence occurs when surface waters move toward each other. In the North Atlantic Ocean, for instance, the Gulf Stream, the Labrador Current, and the East Greenland Current all come together in the same region of the ocean. When currents converge, water stacks up and has no place to go but downward. The surface water slowly sinks in a process called downwelling . Unlike upwelling, areas of downwelling are not associated with prolific marine life because the necessary nutrients are not continuously replenished from cold, nutrient-rich deep water below. Consequently, downwelling areas have low productivity.

Coastal Upwelling
- Ekman transport moves surface seawater offshore.
- Cool, nutrient-rich deep water comes up to replace displaced surface waters.
- Western U.S. and cool San Francisco temperatures

Coastal Downwelling
- Ekman transport moves surface seawater toward shore.
- Water piles up, moves downward in water column
- Lack of marine life

Other Causes of Upwelling
- Offshore winds
- Seafloor obstruction
- Coastal geometry change
- Lack of pycnocline
– High latitude ocean

Antarctic Circulation
Antarctic Circumpolar Current The main current in Antarctic waters is the Antarctic Circumpolar Current, which is also called the West Wind Drift.
- Antarctic Circumpolar Current
– Also called West Wind Drift and Penguin Gyre
– Only current to completely encircle Earth
– Moves more water than any other current - Antarctic Convergence
– Cold, dense Antarctic waters converge with warmer, less dense sub-Antarctic waters.
– Northernmost boundary of Antarctic Ocean - East Wind Drift
– Polar Easterlies
– Creates surface divergence with opposite flowing Antarctic Circumpolar Current - Antarctic Divergence
– Abundant marine life

easterlies and flows around Antarctica from the east. The Antarctic Circumpolar Current (West Wind Drift) flows around Antarctica from the west but is further from the continent and is a result of the strong prevailing westerlies. The Antarctic Convergence and Antarctic Divergence are caused by interactions at the boundaries of these two currents.
Atlantic Ocean Circulation
- North Atlantic Subtropical Gyre
– North Equatorial Current
– Gulf Stream
– North Atlantic Current
– Canary Current
– South Equatorial Current
– Atlantic Equatorial Counter Current
![Chapter 7 Lecture: Ocean Circulation North Atlantic Ocean circulation. Map of major
currents in the North Atlantic Gyre, showing average flow rates in
Sverdrups (1 Sverdrup = 1 million cubic meters [35.3 million cubic
feet] per second). The four major currents include the western
intensified Gulf Stream, the North Atlantic Current, the Canary
Current, and the North Equatorial Current, but there are many
complex flow patterns.](https://studyhub.net.in/wp-content/uploads/2024/10/image-186.png)
Sverdrups (1 Sverdrup = 1 million cubic meters [35.3 million cubic feet] per second). The four major currents include the western intensified Gulf Stream, the North Atlantic Current, the Canary Current, and the North Equatorial Current, but there are many complex flow patterns.
- South Atlantic Subtropical Gyre
– Brazil Current
– Antarctic Circumpolar Current
– Benguela Current
– South Equatorial Current

Gulf Stream
The Gulf Stream is the world’s best studied ocean current. It moves northward along the East Coast of the United States, warming coastal states and moderating winters in these and northern European regions.
- Best studied of all ocean currents
- Meanders and loops
- Merges with Sargasso Sea
– Circulates around center of North Atlantic Gyre
– Unique biology – Sargassum - Meanders or loops may cause loss of water volume and generate:
– Warm-core rings – warmer Sargasso Sea water trapped in loop surrounded by cool water
– Cold-core rings – cold water trapped in loop surrounded by warmer water - Unique biological populations

(a) A NOAA satellite false-color image of sea surface temperature and
(b) a matching map of the same area, showing the development of warm- and cold-core rings (eddies).
Loop Current
The Loop Current is a warm ocean surface current in the Gulf of Mexico that flows northward between Cuba and the Yucatán Peninsula, moves north into the Gulf of Mexico, loops east and south before exiting to the east through the Florida Straits and eventually merging with other waters to form the Gulf Stream
- Warm ocean surface current in Gulf of Mexico
- Generates warm loop current eddies
- Hurricanes intensify when passing over warm cores.

Other North Atlantic Currents
- Labrador Current
- Irminger Current
- Norwegian Current
- North Atlantic Current
Climate Effects of North Atlantic Currents
- North-moving currents – warm
- Gulf Stream warms east coast of United States and northern Europe
- North Atlantic and Norwegian Currents warm northwestern Europe
- South-moving currents – cool
- Labrador Current cools eastern Canada
- Canary Current cools north African coast
Indian Ocean Circulation
The Indian Ocean exists predominantly in the Southern Hemisphere. From November to March, equatorial circulation in the Indian Ocean resembles that in the Atlantic Ocean, featuring two westward-flowing equatorial currents—the North Equatorial Current and the South Equatorial Current—separated by an eastward-flowing Equatorial Countercurrent. However, compared to circulation in the Atlantic, the Equatorial Countercurrent in the Indian Ocean is positioned more southerly due to the ocean’s geographical location. The unique shape of the Indian Ocean basin and its proximity to the high mountains of Asia contribute to significant seasonal variations in its circulation patterns.
- Monsoons – seasonal reversal of winds over northern Indian Ocean
- Heat Capacity Differential
- Northeast monsoon – winter
- Southwest monsoon – summer
Indian Ocean Monsoon
- Affects seasonal land weather
- Affects seasonal Indian Ocean current circulation
- Affects phytoplankton productivity
Indian Ocean Subtropical Gyre
Indian Ocean Subtropical Gyre Surface circulation in the southern Indian Ocean (the Indian Ocean Subtropical Gyre) is similar to subtropical gyres observed in other southern oceans. When the northeast trade winds blow, the South Equatorial Current provides water for the Equatorial Countercurrent and the Agulhas Current, which flows southward along Africa’s east coast and joins the Antarctic Circumpolar Current (West Wind Drift). The Agulhas Retroflection is created when the Agulhas Current makes an abrupt turn as it meets the strong Antarctic Circumpolar Current. Turning northward out of the Antarctic Circumpolar Current is the West Australian Current, an eastern boundary current that merges with the South Equatorial Current, completing the gyre.
Pacific Ocean Circulation
- North Pacific Subtropical Gyre
– Kuroshio Current
– North Pacific Current
– California Current
– North Equatorial Current
– Alaskan Current - South Pacific Subtropical Gyre
– East Australian Current
– Antarctic Circumpolar Current
– Peru Current
– South Equatorial Current
– Equatorial Counter Current
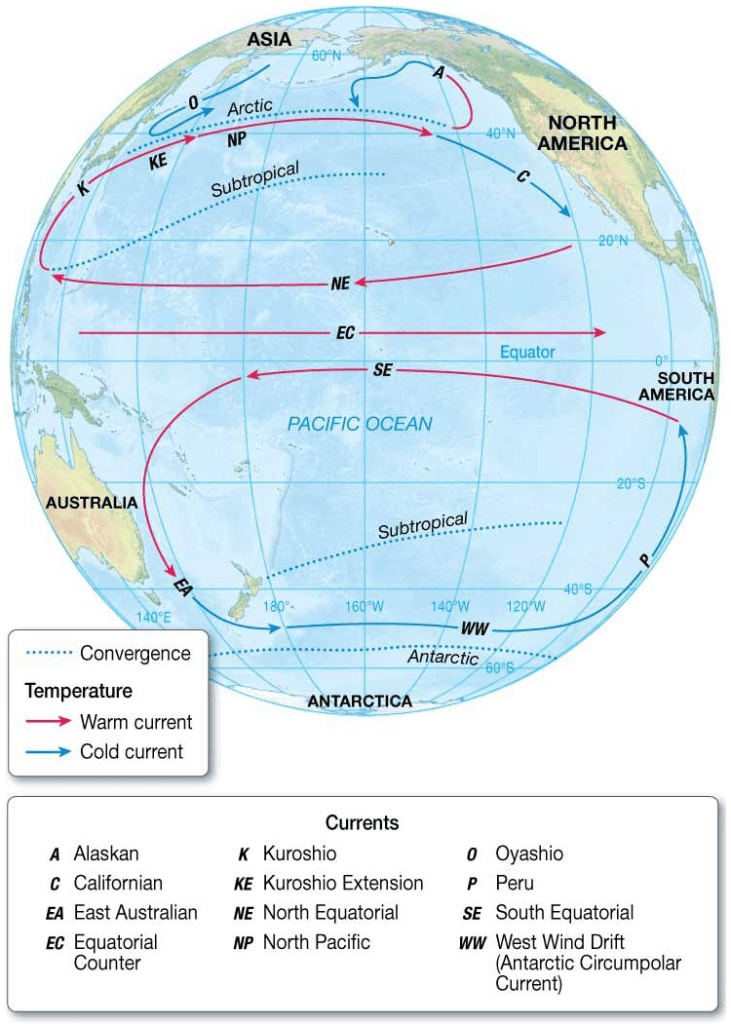
Atmospheric-Ocean Connections in the Pacific Ocean
- Walker Circulation Cell – normal conditions
– Air pressure across equatorial Pacific is higher in eastern Pacific.
– Strong southeast trade winds
– Pacific warm pool on western side of ocean
– Thermocline deeper on western side
– Upwelling off the coast of Peru
Normal Conditions, Walker Circulation
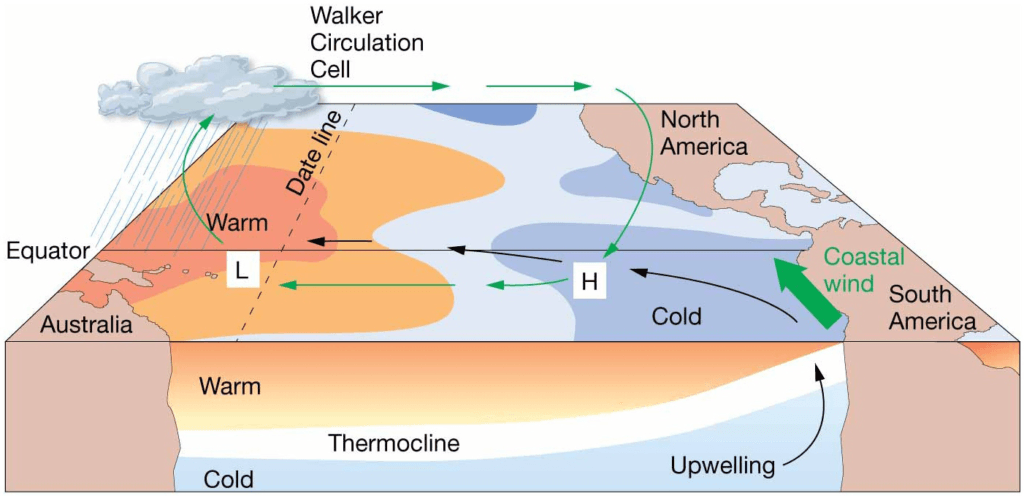
El Niño – Southern Oscillation (ENSO) Walker Cell Circulation disrupted
- High pressure in eastern Pacific weakens.
- Weaker trade winds
- Warm pool migrates eastward
- Thermocline deeper in eastern Pacific
- Downwelling
- Lower biological productivity
– Peruvian fishing suffers
La Niña – ENSO Cool Phase
- Increased pressure difference across
equatorial Pacific - Stronger trade winds
- Stronger upwelling in eastern Pacific
- Shallower thermocline
- Cooler than normal seawater
- Higher biological productivity
Occurrence of ENSO Events
- El Niño warm phase about every 2–10 years
- Highly irregular
- Phases usually last 12–18 months
- 10,000-year sediment record of events
- ENSO may be part of Pacific Decadal Oscillation (PDO)
– Long-term natural climate cycle
– Lasts 20–30 years
ENSO Index

ENSO Has Global Impacts
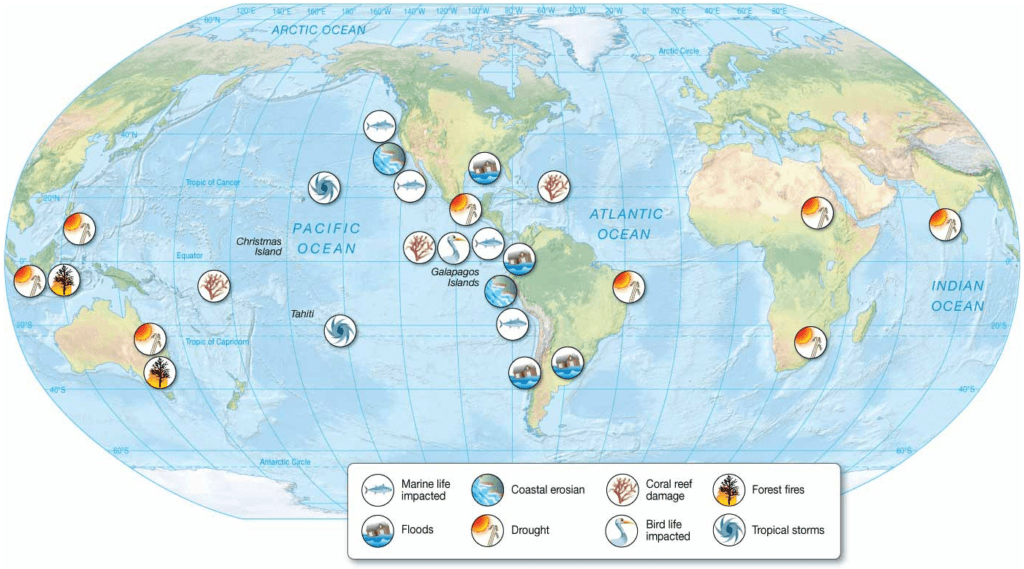
Notable ENSO Events
- 1982–1983
- 1997–1998
- Flooding, drought, erosion, fires, tropical storms, harmful effects on marine life
- Unpredictable
Predicting El Niño Events
- Tropical Ocean−Global Atmosphere (TOGA) program
– 1985
– Monitors equatorial South Pacific
– System of buoys - Tropical Atmosphere and Ocean (TOA) project
– Continues monitoring - ENSO still not fully understood
Deep-Ocean Currents
- Thermohaline Circulation – deep ocean circulation driven by temperature and density differences in water
- Below the pycnocline
- 90% of all ocean water
- Slow velocity
Thermohaline Circulation
- Originates in high latitude surface ocean
- Cooled, now dense surface water sinks and changes little.
- Deep-water masses identified on temperature–salinity (T–S) diagram
– Identifies deep water masses based on temperature, salinity, and resulting density

Thermohaline Circulation
- Some deep-water masses
– Antarctic Bottom Water
– North Atlantic Deep Water
– Antarctic Intermediate Water
– Oceanic Common Water - Cold surface seawater sinks at polar regions and moves equatorward.
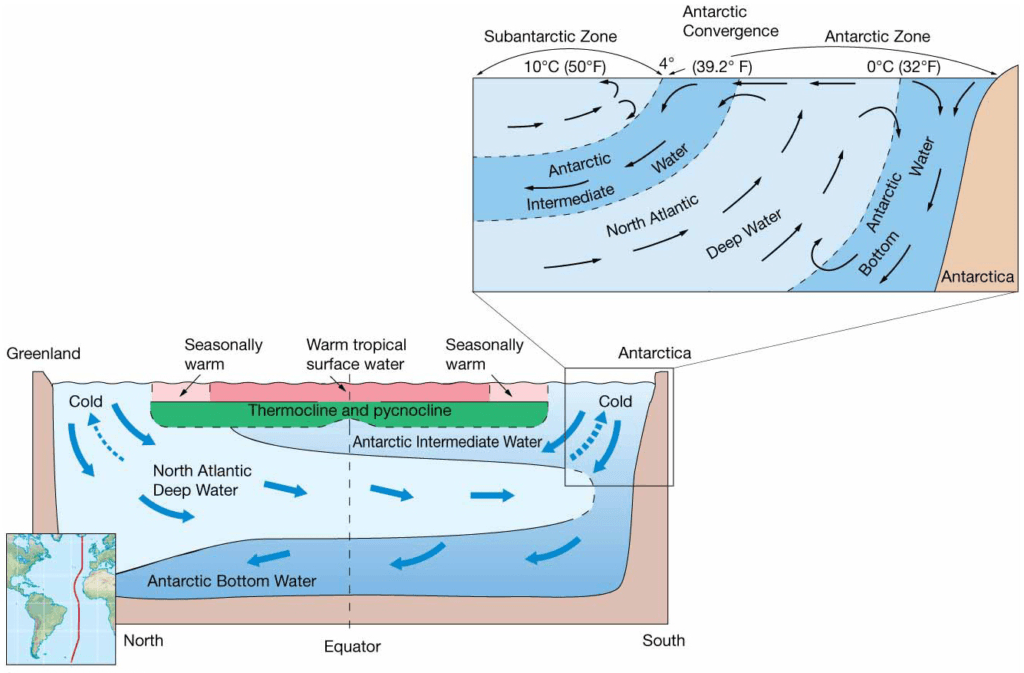
Conveyor Belt Circulation
Conveyer-Belt Circulation An integrated model combining deep thermohaline circulation and surface currents is shown. Because the overall circulation pattern resembles a large conveyer belt, the model is called conveyer-belt circulation. Beginning in the North Atlantic, surface water carries heat to high latitudes via the Gulf Stream. During the cold winter months, this heat is transferred to the overlying atmosphere, warming northern Europe.
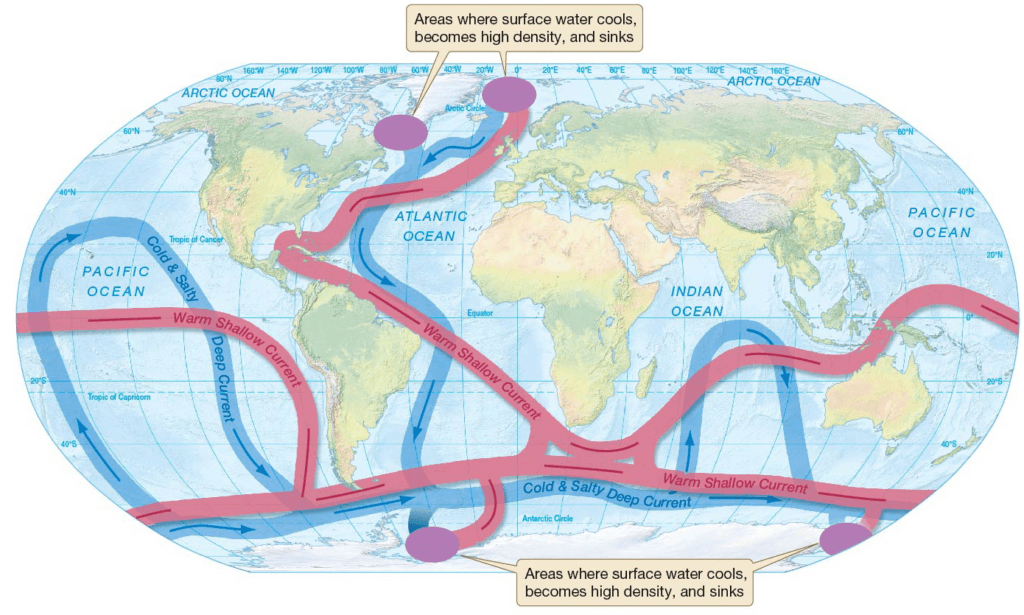
Reference: All images and content are taken from Essentials of Oceanography by Alan P. Trujillo and Harold V. Thurman, 12th Edition.

Üsküdar su kaçağı tespiti uzmanı Testo termal kamera sayesinde Üsküdar’daki evimdeki su kaçağını sorunsuzca tespit ettiler. https://www.gumrukmedyasi.com/blogs/363/%C3%9Csk%C3%BCdar-Su-Ka%C3%A7a%C4%9F%C4%B1-bulma