An ecological pyramid is a graphical representation showing the distribution of energy, biomass, or organism numbers across trophic levels in an ecosystem, with producers at the base and apex predators at the top, demonstrating energy flow efficiency.
What is the ecological pyramid?
The hierarchical organization of trophic levels illustrated through a visual format is known as ecological pyramids. At the base of this pyramid lie the primary producers, while the apex is occupied by the top-level carnivores. Positioned between these two are the remaining consumer trophic levels.
This pyramid comprises multiple horizontal segments, each denoting a distinct trophic level, arranged in order beginning from the producer tier, followed by herbivores, and progressing to carnivores and beyond. The length of every segment reflects the total count of organisms present at that specific trophic level within an ecosystem.
From the producer stage to higher consumer levels, there is a gradual reduction in the number, biomass, and energy of organisms. This progressive decline gives the graphical layout a distinct pyramidal configuration.
What are the three basic types of ecological pyramids?
Ecological pyramids are classified into three fundamental types:
- Pyramid of numbers
- Pyramid of biomass
- Pyramid of energy or productivity
Pyramid of Numbers
- This concept pertains to the correlation between the quantities of primary producers and consumers across various trophic levels. It presents a graphical depiction of the aggregate number of individual organisms of diverse species corresponding to each trophic level within an ecosystem.
- Based on the biomass and size of organisms, the pyramid of numbers does not necessarily maintain an upright structure and, in certain instances, may appear entirely inverted.
(a) Upright Pyramid of Numbers
- In this format, the number of organisms diminishes progressively from the lowest to the highest trophic levels.
- This structural form is commonly observed within a grassland ecosystem.
- At the base, grasses dominate due to their abundant presence, occupying the lowest trophic level.
- The level immediately above comprises the primary consumers, typically herbivores (e.g., grasshoppers).
- The population size of grasshoppers is less than that of grasses. Succeeding this is the primary carnivore level (e.g., rats).
- The number of rats is lower than that of grasshoppers, as they depend on grasshoppers for food. The subsequent level includes the secondary carnivores (e.g., snakes), which prey on rats.
- Following this is the top carnivore level, such as the hawk.
- As the trophic level ascends, the number of organisms continually declines.
(b) Inverted Pyramid of Numbers
- In this configuration, the quantity of organisms increases progressively from the lower to the higher trophic levels.
- In a forest ecosystem, the count would reveal a limited number of large-sized producers, such as a few substantial trees.
- This occurs because the trees, serving as primary producers, are relatively few and occupy the pyramid’s base, whereas the herbivores (e.g., birds) relying on them are found at the next trophic level, followed by parasites one level higher. At the topmost level, hyperparasites—though at a higher trophic rank—are more numerous.
- This structural arrangement results in a reverse pyramidal form. A pyramid of numbers does not consider the variation in organism size across trophic levels.
- Accurately enumerating all living organisms in a pyramid of numbers presents a significant challenge, and thus this type of pyramid does not comprehensively represent the trophic organization within an ecosystem.
Pyramid of Biomass
- To address the limitations inherent in the pyramid of numbers, the concept of the pyramid of biomass is employed. In this method, instead of counting individual organisms at each trophic level, their mass is calculated. This produces what is known as the pyramid of biomass, representing the total dry weight of all living beings at each trophic tier at a specific moment in time.
- The pyramid of biomass is generally established by isolating all organisms at every trophic level and determining their dry weight. This method resolves the issue of organism size disparity, as all biological entities at a given level are uniformly weighed. Biomass is typically expressed in g/m².
(a) Upward Pyramid
In most terrestrial ecosystems, the biomass pyramid takes an upright form, characterized by an extensive primary producer base, with progressively smaller trophic levels stacked above.
- The autotrophic producers possess the greatest biomass.
- The subsequent level, the primary consumers, exhibits a lower biomass than the producers.
- The next level, comprising secondary consumers, contains even less biomass than the primary consumers.
- At the topmost trophic level, the amount of biomass is minimal.
(b) Inverted Pyramid
- In contrast to terrestrial systems, numerous aquatic ecosystems exhibit a pyramid of biomass that takes an inverted configuration.
- This occurs because the primary producers in such environments are minute phytoplankton, which possess the ability to grow and reproduce rapidly. In these cases, the base of the pyramid—representing producer biomass—is relatively small, whereas the biomass of consumers at any given time exceeds that of the producers, resulting in an inverted pyramid structure.
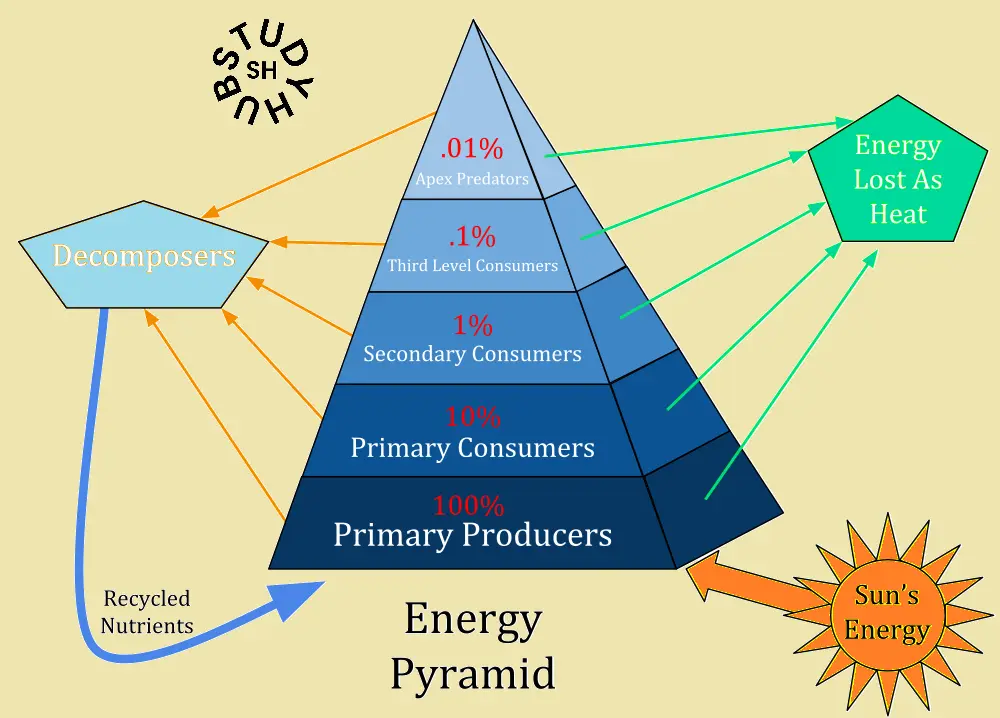
Pyramid of Energy
- To effectively analyze the functional significance of various trophic levels within an ecosystem, the energy pyramid serves as the most appropriate model. This type of pyramid illustrates the principles of thermodynamics, showing how solar energy is transformed into chemical energy and subsequently dissipated as heat at every trophic level. The energy loss occurring during each transfer between levels is clearly represented, ensuring that the pyramid remains upright at all times, with a broad energy foundation positioned at the base.